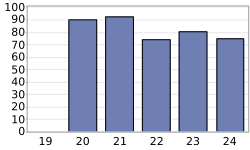
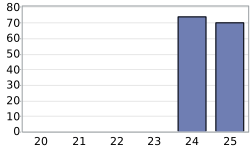
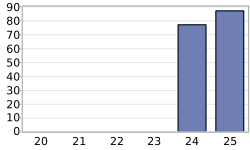
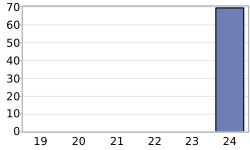
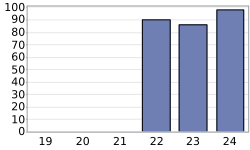
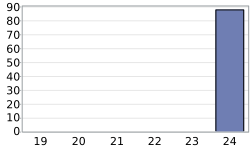
Direct judge report · TRAC Immigration · Source
- Decisions
- 996
- Any relief granted
- 11.9%
- Denied
- 88.1%
- Court denial benchmark
- 85.0%
- U.S. denial benchmark
- 62.9%
- Outcome difference vs court
- +3.1 pp
Direct judge report · TRAC Immigration · Source
- Decisions
- 307
- Any relief granted
- 25.7%
- Denied
- 74.3%
- Court denial benchmark
- 65.4%
- U.S. denial benchmark
- 62.9%
- Outcome difference vs court
- +8.9 pp
Court denial position: 69th percentile
Judge outcome spread
13 qualifying direct judges · P25 59.5% · Median 70.1% · P75 80.3% · IQR 20.8%
Peers are restricted to direct-data judges at the same TRAC report court and reporting period; at least five qualifying judges are required. Tied denial rates share the same competition rank.
Direct judge report · TRAC Immigration · Source
- Decisions
- 167
- Any relief granted
- 22.2%
- Denied
- 77.8%
- Court denial benchmark
- 77.1%
- U.S. denial benchmark
- 62.9%
- Outcome difference vs court
- +0.7 pp
Direct judge report · TRAC Immigration · Source
- Decisions
- 121
- Any relief granted
- 33.1%
- Denied
- 66.9%
- Court denial benchmark
- 52.6%
- U.S. denial benchmark
- 62.9%
- Outcome difference vs court
- +14.3 pp
Court denial position: Rank 2 of 7 · 86th percentile
Judge outcome spread
7 qualifying direct judges · P25 62.1% · Median 65.9% · P75 66.8% · IQR 4.7%
Peers are restricted to direct-data judges at the same TRAC report court and reporting period; at least five qualifying judges are required. Tied denial rates share the same competition rank.
Direct judge report · TRAC Immigration · Source
- Decisions
- 208
- Any relief granted
- 42.3%
- Denied
- 57.7%
- Court denial benchmark
- 64.3%
- U.S. denial benchmark
- 62.9%
- Outcome difference vs court
- -6.6 pp
Direct judge report · TRAC Immigration · Source
- Decisions
- 180
- Any relief granted
- 1.1%
- Denied
- 98.9%
- Court denial benchmark
- 80.0%
- U.S. denial benchmark
- 62.9%
- Outcome difference vs court
- +18.9 pp
Court denial position: Rank 1 of 6 · 100th percentile
Judge outcome spread
6 qualifying direct judges · P25 81.9% · Median 86.9% · P75 88.7% · IQR 6.8%
Peers are restricted to direct-data judges at the same TRAC report court and reporting period; at least five qualifying judges are required. Tied denial rates share the same competition rank.
Direct judge report · TRAC Immigration · Source
- Decisions
- 529
- Any relief granted
- 23.3%
- Denied
- 76.7%
- Court denial benchmark
- 76.5%
- U.S. denial benchmark
- 62.9%
- Outcome difference vs court
- +0.2 pp
Court denial position: 56th percentile
Judge outcome spread
16 qualifying direct judges · P25 67.9% · Median 76.6% · P75 85.4% · IQR 17.5%
Peers are restricted to direct-data judges at the same TRAC report court and reporting period; at least five qualifying judges are required. Tied denial rates share the same competition rank.
Direct judge report · TRAC Immigration · Source
- Decisions
- 457
- Any relief granted
- 2.8%
- Denied
- 97.2%
- Court denial benchmark
- 86.7%
- U.S. denial benchmark
- 62.9%
- Outcome difference vs court
- +10.5 pp
Court denial position: 86th percentile
Judge outcome spread
14 qualifying direct judges · P25 89.3% · Median 91.6% · P75 96.1% · IQR 6.8%
Peers are restricted to direct-data judges at the same TRAC report court and reporting period; at least five qualifying judges are required. Tied denial rates share the same competition rank.
Direct judge data
Current EOIR assignment: Conroe Immigration Court
TRAC report court: Houston - Greenspoint Immigration Court
Direct judge report · TRAC Immigration · Source
- Decisions
- 591
- Any relief granted
- 11.2%
- Denied
- 88.8%
- Court denial benchmark
- 89.4%
- U.S. denial benchmark
- 62.9%
- Outcome difference vs court
- -0.6 pp
Court denial position: 50th percentile
Judge outcome spread
14 qualifying direct judges · P25 86.9% · Median 89.3% · P75 92.1% · IQR 5.2%
Peers are restricted to direct-data judges at the same TRAC report court and reporting period; at least five qualifying judges are required. Tied denial rates share the same competition rank.
Direct judge report · TRAC Immigration · Source
- Decisions
- 352
- Any relief granted
- 15.9%
- Denied
- 84.1%
- Court denial benchmark
- 69.2%
- U.S. denial benchmark
- 62.9%
- Outcome difference vs court
- +14.9 pp